The multi-scale structure changes of five underutilized starches, including waxy proso millet (PMS) and amaranth (AS) starches, non-waxy foxtail millet (FMS), buckwheat (BS) and oat (OS) starches, were investigated after modification with acetic anhydride (0.0165 mol) and vinyl acetate (0.0165 mol). Five starches exhibited a higher proportion of short chains compared to waxy and normal maize starches. Degree of substitution (DS) of acetylated starches ranged 0.03 to 0.08. Vinyl acetate modified non-waxy starches showed higher DS values than waxy starches, while acetic anhydride modified waxy starches exhibited higher DS values than non-waxy starches. Vinyl acetate reduced relative crystallinity (RC) by 1.3 % in PMS, 5.7 % in FMS, and 12.5 % in OS, whereas acetic anhydride did not significantly decrease RC for AS, FMS, BS and OS. For the non-waxy starches, gelatinization enthalpies after vinyl acetate modification were 4–22 % lower than after acetic anhydride modification. Additionally, the increase in amorphous lamellae thickness (da) of PMS, AS, BS and OS was greater with vinyl acetate than acetic anhydride, indicating that vinyl acetate more effectively disrupted crystalline lamellae. Overall, the presence of amylose influenced DS of modified starches. However, change of supramolecular structure was independent of DS but dependent on the acetylation reagent.
In the present study, the solid–liquid phase diagrams of four systems acetic acid + acetic anhydride, propionic acid + acetic anhydride, butyric acid + acetic anhydride, and pentanoic acid + acetic anhydride were determined by differential scanning calorimetry at atmospheric pressure. The experimental results illustrated that these systems showed a eutectic behavior. The experimental data were compared with predicted data acquired by solving the phase equilibrium equations using an algorithm. The liquid-phase activity coefficients were calculated by the Wilson and nonrandom two-liquid activity coefficient models. The results show that the approaches used for the calculated system equilibrium was capable to accurately describe the eutectic solid–liquid phase diagrams of the above-mentioned systems.


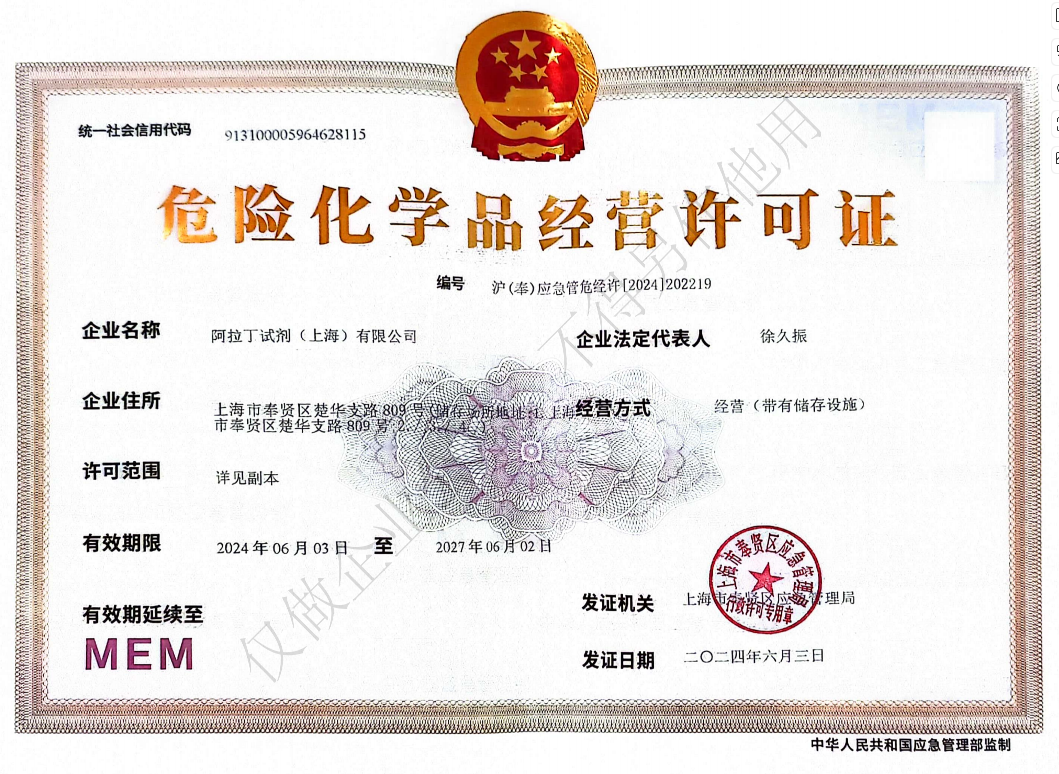 危险品化学品经营许可证(带存储)