生物素,亦称维生素H,是一种广泛存在于所有活体细胞内的小分子物质。由于生物素分子量很小,偶联后基本不会改变蛋白空间构象与生物活性,因此生物素广泛用于抗体、目标蛋白的生物素标记实验。
阿拉丁生产的生物素定量检测试剂盒(HABA,显色法)可快速定量检测抗体或蛋白等被生物素标记水平或样品中生物素的浓度。HABA,即4'-羟基偶氮苯-2-羧酸,是一种小分子染料,可以与链霉亲和素发生弱相互作用。检测原理:HABA与链霉亲和素(Streptavidin, SA)结合形成复合物,该复合物的最大吸收峰为500 nm;而生物素与链霉亲和素的亲和力远强于HABA,所以当溶液中存在游离生物素或生物素标记蛋白时,会竞争性置换HABA,导致500 nm吸光度降低。试剂盒提供HABA/SA混合液、生物素标品、阳性对照和反应缓冲液, 可通过差值法和标准曲线法快速进行生物素定量,计算生物素-蛋白摩尔比,标准曲线法可以检测生物素溶液的浓度范围为2-40 μM(400pmol-8000pmol)。本试剂盒包含两种规格,可检测100个或500个样品。
产品组分
| 组分货号 | 组分名称 | 物理外观 | 100T | 500T | 储存 | 单次测试使用量 |
| B1524815A | HABA/SA混合液 | 液体 | 2 mL | 10 mL | -20℃, 避光 | 每次反应需使用20 μL |
| B1524815B | 反应缓冲液 | 液体 | 20 mL | 100 mL | -20℃. | 每次反应需使用160 μL |
| B1524815C | Biotin标准品 (500μM) | 液体 | 1 mL | 5 mL | -20℃, 避光 | 按照需求使用 |
| B1524815D | BSA-Biotin (阳性对照)
| 液体 | 0.5 mL | 1.5 mL | -20℃, 避光 | 按照需求使用 |
其他所需试剂
1. 96孔平底透明酶标板。
2. 多功能酶标分光光度计。
3. 离心机。
重要须知
1. HABA/SA混合液对光敏感,试剂避光保存,复溶后尽快使用。
2. 试剂避免反复冻融,建议分装后保存。
3. 严禁使用含钾离子的缓冲液,钾离子会引起反应体系沉淀。样品应溶解在无钾PBS(磷酸钠)或TBS中。
4. 反应体系严禁含有DTT、β-巯基乙醇等还原剂,会破坏链霉亲和素结构,导致吸光度异常。
5. 反应缓冲液在-20℃保存后融化如果有沉淀析出,可37℃水浴加热直至完全溶解。
6. BSA-Biotin仅作为生物素标记的阳性对照,不提供具体的生物素标记数量。
7. 在正式实验前,需将试剂恢复至室温,在使用前将试剂进行离心。
8. 操作过程中,务必穿戴实验服、一次性手套及防护装备。
9. 所有产品仅限于研究用途。
使用说明
1. 差值法
1.1 将20 μL HABA/SA混合液, 160 μL 反应缓冲液,依次加至96孔平底透明酶标板,轻轻混匀,避免起泡。
1.2 酶标仪读取500 nm 吸光度,记为A₅₀₀HABA/SA(缩写为:A₅₀₀H\S)。
1.3 将96孔酶标板取出,向不同的孔分别加入20 μL样品、BSA-Biotin(阳性对照)、反应缓冲液(阴性对照),轻轻混匀,避免起泡。
1.4 酶标仪读取500 nm 吸光度,记为A₅₀₀HABA/SA/Biotin(缩写为:A₅₀₀H\S\B)。
注意:如果A₅₀₀ H\S\B<0.15,建议用反应缓冲液对生物素标记的抗体或蛋白进行稀释后再次检测;如果A₅₀₀H\S\B)>0.43,建议对生物素标记的抗体或蛋白进行浓缩后再次检测。
2. 直接定量计算
推荐:阿拉丁提供“生物素定量计算表格”下载,只需输入各项数值,就可自动得到生物素/抗体或蛋白的摩尔比。
2.1 计算500 nm吸光度差值
∆A₅₀₀=A₅₀₀H\S-A₅₀₀H\S\B
2.2 计算反应体系中Biotin的摩尔浓度
基于朗伯-比尔定律,由吸光度差值换算稀释后体系的生物素浓度:
Biotin(mM)=∆A₅₀₀/(34500× L (cm))
注1. HABA-SA混合液在500nm吸光度的消光系数 ε ( M⁻¹ cm⁻¹ ) =34500 M⁻¹·cm⁻¹
注2. 光径参数 L (cm):通常96孔酶标板200 μL溶液的光路长度为0.5 cm。
2.3 计算原始蛋白样品摩尔浓度
Protein(mM)=蛋白浓度(mg/mL)/蛋白分子量(Da)
2.4 生物素-蛋白摩尔比
还原样品稀释倍数,计算单个蛋白分子平均偶联生物素数量:
Biotin(mM)/Protein(mM)=Biotin(mM)×10×预稀释倍数/Protein(mM))
注1. 10指体系稀释倍数,20 μL样品+180 μL反应液,样品10倍稀释。
注2. 预稀释倍数 (Dilution factor)指因初始时生物素标记的抗体或蛋白浓度过高导致A₅₀₀ H\S\B<0.15,而额外对生物素标记的抗体或蛋白进行稀释的倍数,未稀释则取值为1。
3. 生物素标准曲线法
为避免可能的消光系数和光径的差错,可以选择Biotin标准曲线法。
3.1 标准曲线配制
按照下表体积直接加入96孔酶标板中:
管编号 | Biotin标准品 (500μM) 体积(μL) | 反应缓冲液(μL) | 终浓度(μM) | 反应体系内总生物素量 (nmol)¹ |
1² | 0 | 20 | 0 | 0 |
2 | 1 | 19 | 2.5 | 0.5 |
3 | 2 | 18 | 5 | 1 |
4 | 4 | 16 | 10 | 2 |
5 | 6 | 14 | 15 | 3 |
6 | 8 | 12 | 20 | 4 |
7 | 10 | 10 | 25 | 5 |
8 | 12 | 8 | 30 | 6 |
9 | 14 | 6 | 35 | 7 |
10 | 16 | 4 | 40 | 8 |
注¹:反应体系为200 μL,计算所得总生物素量(nmol)为每孔加入20 μL样品/标准品的生物素含量。
注²:为空白对照 。
3.2 加样:向酶标板各孔分别加入20 μL:样品、BSA-Biotin (阳性对照),各梯度标准品1-10管。
3.3 样品检测
3.3.1 按照下表向酶标板各孔加入相应溶液:
试剂名称 | 测定管 | 阳性对照 | 标准管 |
反应缓冲液 | 160 μL | 160 μL | 160 μL |
HABA-SA混合液 | 20 μL | 20 μL | 20 μL |
Biotin标准品 (500μM) | 0 μL | 0 μL | 20 μL³ |
BSA-Biotin (阳性对照) | 0 μL | 20 μL | 0 μL |
样品 | 20 μL | 0 μL | 0 μL |
注³:按照3.1表格配制各梯度标准品1-10管。
3.3.2 轻轻混匀,避免起泡,于酶标仪读取500 nm吸光度。
注意:如果 A₅₀₀H\S\B<0.15,建议用反应缓冲液对生物素标记的抗体或蛋白进行稀释后再次检测;如果 A₅₀₀H\S\B>0.43,建议对生物素标记的抗体或蛋白进行浓缩后再次检测。
3.4 数据计算分析
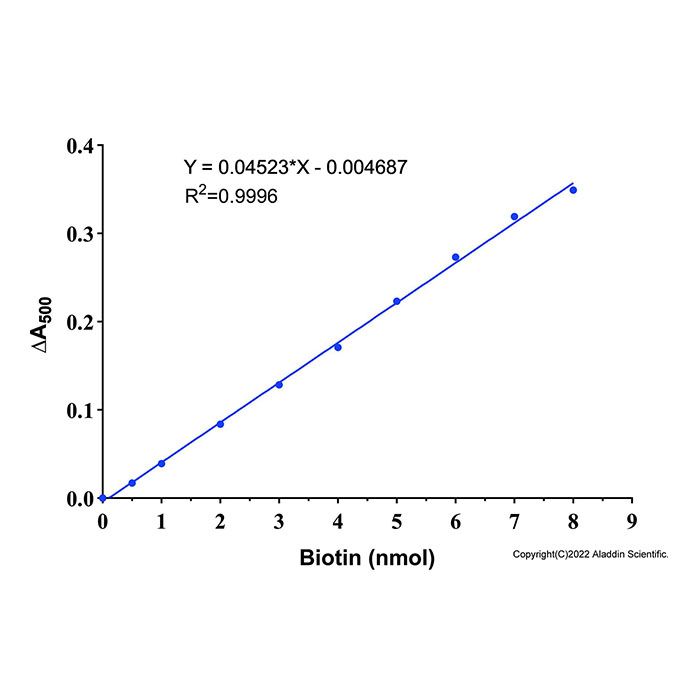
3.4.1 以Biotin物质的量(nmol)为X轴,∆ A₅₀₀ 标准管= A₅₀₀ 空白对照- A₅₀₀ 标准管为Y轴,建立标准曲线(直线线性关系) (图1),拟合得到公式;根据公式计算样品中生物素总摩尔量(nmol)。

图1 阿拉丁生物素定量检测试剂盒(HABA,显色法) (B1524815)的Biotin标准曲线示意图。实际检测数据会因实验条件、检测仪器等的不同而存在差异,图中数据仅供参考。
3.5 生物素标记摩尔比
生物素标记摩尔比=n(Biotin)/n(Protein)
n(Protein)=(c×20)/(M ×10⁶)
注:
c:生物素标记蛋白浓度(mg/mL)
20:上样体积(μL)
M :目标蛋白分子量(g/mol)
注意:n(Biotin)是反应孔内样品的生物素总量, n(Protein)也是反应孔内样品的蛋白总量,需要保持一致。
4. 计算结果代表:生物素标记摩尔比,即平均每个蛋白分子上偶联的生物素分子个数;IgG抗体最优标记区间为2.0-6.0,标记过高会造成抗体活性下降,标记过低信号偏弱。
Biotin, also known as vitamin H, is a small molecule that is present in tiny amounts in all living cells and is critical for a number of biological processes. Due to the low molecular weight of biotin, biotin usually does not cause any significant changes in protein conformation and biological activity. Therefore, biotin is widely applied for biotin-labeling of antibodies and other proteins of interest.
The Aladdin Biotin Quantitation Kit (HABA, Colorimetric Method) permits rapid quantification of biotin-labeling level for antibodies, proteins and other biomolecules, as well as biotin concentrations within test samples. HABA, chemically designated as 4'-hydroxyazobenzene-2-carboxylic acid, is a small-molecular-weight dye capable of weak intermolecular interaction with streptavidin (SA). Assay Principle: HABA associates with streptavidin (SA) to yield a complex exhibiting an absorption maximum at 500 nm. Because of its higher affinity for avidin, biotin displaces the HABA and the absorbance at 500nm decreases proportionately. Accordingly, the presence of free biotin or biotin-conjugated proteins in solution produces a reduction in absorbance at 500 nm. The kit provides HABA/Streptavidin Premix, biotin standard, positive control, and reaction buffer. Both the absorbance difference-value method and biotin standard curve method can be used for biotin quantification and calculation of the biotin-to-protein molar ratio. When using the biotin standard curve method, the kit detects biotin solutions over the range of 2-40 μM (400 pmol-8000 pmol). This kit is available in two sizes: 100-assay and 500-assay.
Contents and storage
| Component No. | Component Name | Appearance | 100T | 500T | Storage | Quantity Per Test |
| B1524815A | HABA/Streptavidin Premix | liquid | 2 mL | 10 mL | -20℃. Store in the dark. | 20 μL for 1 test |
| B1524815B | Reaction Buffer | liquid | 20 mL | 100 mL | -20℃. | 160 μL for 1 test |
| B1524815C | Biotin Standard (500μM) | liquid | 1 mL | 5 mL | -20℃. Store in the dark. | Use as needed
|
| B1524815D | BSA-Biotin (Positive Control)
| liquid | 0.5 mL | 1.5 mL | -20℃. Store in the dark. | Use as needed
|
Required materials not supplied
1. 96-well clear flat-bottom microplate.
2. Multi-well spectrophotometer (ELISA reader).
3. Microcentrifuge.
Important
1. The HABA/Streptavidin Premix is light-sensitive. Store protected from light and use promptly after reconstitution.
2. Aliquot the reagent for storage; avoid repeated freeze-thaw cycles.
3. Avoid potassium-containing buffers; potassium ions induce precipitation within the reaction system. Dissolve samples in potassium-free PBS (sodium phosphate) or TBS.
4. Do not include reducing agents such as DTT or β-mercaptoethanol in the reaction system; these agents disrupt streptavidin structure and cause aberrant absorbance readings.
5. Should precipitate appear after thawing Reaction Buffer stored at -20 °C, incubate at 37 °C in a water bath until completely dissolved.
6. BSA-Biotin serves only as a biotin-labeling positive control. No value for the biotin-to-protein ratio is supplied.
7. Before formal experimentation, the reagents must be returned to room temperature and centrifuged before use. Both lower temperatures and reagent residue on the centrifuge tube walls may impair conjugation efficiency.
8. During operation, always wear a lab coat, disposable gloves, and protective equipment.
9. All products are for research use only.
Instruction for use
1.Absorbance difference method
1.1 Add 20 μL of HABA/SA premix followed by 160 μL of reaction buffer to a 96-well clear flat-bottom microplate. Mix gently and avoid bubble formation.
1.2 Read the absorbance at 500 nm using a microplate reader; record this value as A₅₀₀HABA/SA(A₅₀₀H\S).
1.3 Add 20 µL of target biotinylated protein sample, BSA-Biotin(Positive Control), Reaction Buffer(Negative control). Mix gently and avoid bubble formation.
1.4 Read the absorbance at 500 nm using a microplate reader; record this value as A₅₀₀HABA/SA/Biotin(A₅₀₀H\S\B).
Note: If A₅₀₀H\S\B)<0.15, dilute the biotinylated antibody or protein with reaction buffer and retest. If A₅₀₀H\S\B)>0.43, concentrate the biotinylated antibody or protein and retest.
2. Direct Quantitation
Recommended: Aladdin provides a downloadable Biotin Quantitation Calculation Sheet. Simply input all measured values to automatically obtain the biotin-to-antibody or biotin-to-protein molar ratio.
2.1 Calculation for the change in absorbance at 500 nm
∆A₅₀₀=A₅₀₀H\S-A₅₀₀H\S\B
2.2 Calculation for the molar concentration of biotin in the reaction system
Based on the Beer-Lambert Law, the biotin concentration in the diluted system is calculated from the absorbance change.
Biotin(mM)=∆A₅₀₀/(34500× L (cm) )
Where:
The extinction coefficient of the HABA-SA mixture at 500 nm is ε ( M⁻¹ cm⁻¹ ) =34500 M⁻¹ cm⁻¹.
L (cm) is the cell path length expressed in centimeters (cm). For a 96-well microplate with 200 μL solution, the path length is typically 0.5 cm.
2.3 Calculation for the molar concentration of the original protein sample
Protein(mM)=protein concentration (mg/mL)/MW of protein (Da)
2.4 Calculation for the mmol of biotin per mmol of protein
Calculation for correcting the sample dilution factor to obtain the average number of biotin molecules conjugated per protein molecule:
Biotin(mM)/Protein(mM)=Biotin(mM)×10×Dilution factor/Protein(mM)
Where:
10 refers to the dilution factor of the system. 20 μL sample plus 180 μL reaction mixture results in a 10-fold dilution of the sample.
The dilution factor is the extra dilution applied to biotinylated antibody/protein when high initial concentration leads to A₅₀₀H\S\B < 0.15; use 1 if no dilution is done.
3. Standard-Curve Calibration
To avoid potential errors in the extinction coefficient and path length, the biotin standard curve method may be used.
3.1 Standard Curve Preparation
Add directly to the 96-well microplate using the volumes in the table below:
Tube | Volume of Biotin Standard (500μM) (μL) | Reaction Buffer (μL) | Final Biotin Concentration (µM) | Final Biotin Amount (nmol)¹ |
1² | 0 | 20 | 0 | 0 |
2 | 1 | 19 | 2.5 | 0.5 |
3 | 2 | 18 | 5 | 1 |
4 | 4 | 16 | 10 | 2 |
5 | 6 | 14 | 15 | 3 |
6 | 8 | 12 | 20 | 4 |
7 | 10 | 10 | 25 | 5 |
8 | 12 | 8 | 30 | 6 |
9 | 14 | 6 | 35 | 7 |
10 | 16 | 4 | 40 | 8 |
Note¹: The reaction system volume is 200 μL. The calculated total biotin content (nmol) represents the biotin amount contained in the 20 μL sample/standard added per well.
Note²: Blank control.
3.2 Sample addition: Add 20 μL of sample, BSA-Biotin (positive control), and standards from tubes 1 to 10 of each gradient to respective wells of the microplate.
3.3 Measurement
3.3.1 Add the corresponding solutions to each well of the microplate according to the table below.
Reagent Name | Sample Tube | Positive Control | Standard Tube |
Reaction Buffer | 160 μL | 160 μL | 160 μL |
HABA/Streptavidin Premix | 20 μL | 20 μL | 20 μL |
Biotin Standard (500μM) | 0 μL | 0 μL | 20 μL³ |
BSA-Biotin (Positive Control) | 0 μL | 20 μL | 0 μL |
Sample | 20 μL | 0 μL | 0 μL |
Note³: Prepare each gradient standard from Tube 1 to Tube 10 following the table in Section 3.1.
3.3.2 Mix gently to avoid bubble formation, then read the absorbance at 500 nm using a microplate reader.
Note: If A₅₀₀H\S\B)<0.15, dilute the biotinylated antibody or protein with reaction buffer and retest. If A₅₀₀H\S\B)>0.43, concentrate the biotinylated antibody or protein and retest.
3.4 Data Analysis
3.4.1 Plot the Biotin standard curve with the amount of Biotin (nmol) on the X-axis and ∆ A₅₀₀ standard = A₅₀₀ blank- A₅₀₀ standard on the Y-axis (linear relationship, see Figure 1), and fit to obtain the equation. Use the equation to calculate the total molar amount of biotin (nmol) in samples.
Figure 1 Schematic diagram of the Biotin standard curve for Aladdin Biotin Quantitation Kit (HABA, Colorimetric Method) (B1524815). Actual test data may vary depending on experimental conditions, detection instruments and other factors; the data shown in the figure are for reference only.
3.5 Calculation for the mmol of biotin per mmol of protein
Biotin-to-protein molar ratio=n(Biotin)/n(Protein)
n(Protein)=(c×20)/(M×10⁶)
Where:
c is the concentration of biotinylated protein (mg/mL).
20 is the sample loading volume (μL).
M is the molecular weight of the protein (g/mol)
Note: n(Biotin) refers to total biotin of the sample in the reaction well, and n(Protein) refers to total protein of the sample in the reaction well. The two values must be consistent.
4. The calculated result represents the biotin-to-protein molar ratio, i.e., the average number of biotin molecules conjugated to each protein molecule. The optimal labeling range for IgG antibodies is 2.0-6.0. Over-labeling will reduce antibody activity, whereas under-labeling leads to weak signals.



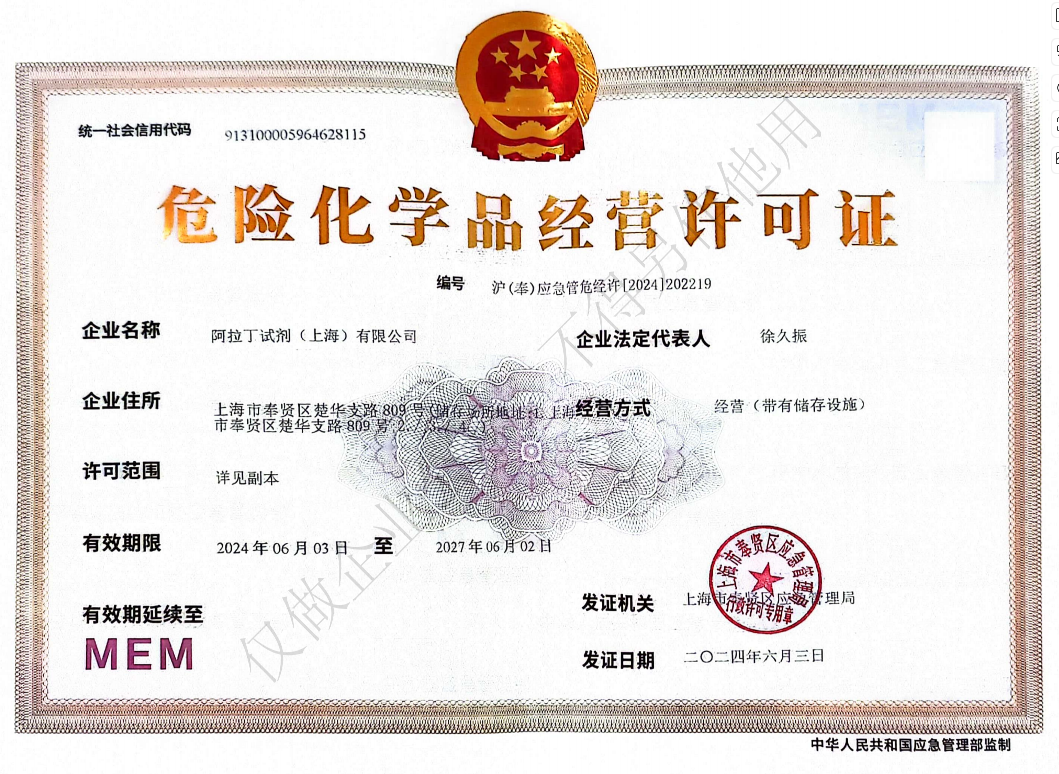 危险品化学品经营许可证(带存储)