糖原是由葡萄糖构成的高分子多糖,是糖主要的储存形式之一,主要贮存在肝和肌肉中作为备用能量,分别称为肝糖原和肌糖原。肝糖原可调节血糖浓度,当血糖升高时可在肝脏合成糖原,血糖降低时,肝糖原则分解为葡萄糖以补充血糖。因此,肝糖原对维持血糖的相对平衡十分重要。肌糖原是肌肉中糖的储存形式,在剧烈运动消耗大量血糖时,肌糖原不能直接分解成血糖,必须先分解产生乳酸,随血液循环到肝脏,通过糖异生转变为肝糖原和葡萄糖。
检测原理:利用强碱性提取液提取糖原,在强酸性条件下与蒽酮显色剂形成在620nm处有特征吸收峰的蓝色化合物,在一定的浓度范围内,糖原含量与620nm吸光度成线性关系,根据 标准曲线,即可计算出样品中糖原的含量。
检测范围:0.003125-0.25 mg/mL
灵敏度: 0.003125 mg/mL
适用样本:动物组织、细菌、细胞
G1501748
| Component
| 96T
| Storage
|
G1501748A
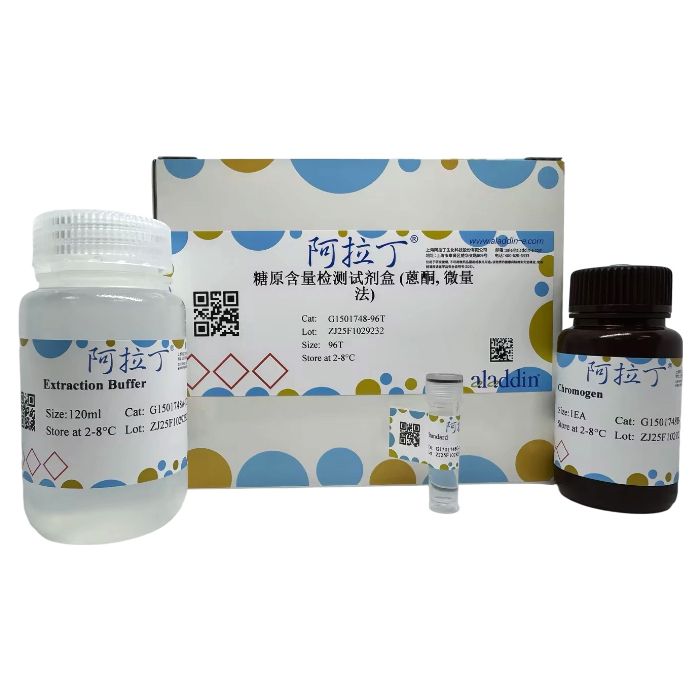
| Extraction Buffer
| 120 mL
| 2-8℃
|
G1501748B
| Chromogen
| 1EA | 2-8℃. Store in the dark.
|
G1501748C
| Standard
| 1 mL | 2-8℃ |
注意:正式检测前,建议选择2-3个预期差异较大的样本进行预实验。
自备仪器和耗材
酶标仪或可见分光光度计(能测620nm处的吸光度)
低温离心机、水浴锅
96孔板或微量玻璃比色皿、可调节式移液枪及枪头、EP管
去离子水,浓硫酸
实验流程
1、试剂准备
试剂名称
| 试剂准备
| 注意事项
|
Extraction Buffer
| 即用型;使用前平衡到室温
| 4℃保存;有腐蚀性 ,操作时请做好防护措施
|
Chromogen
| 先加7.2mL去离子水溶解粉末,然后缓慢加入28.8mL浓硫酸,充分溶解混匀后使用
| 4℃避光保存,有效期为一周;有一定的毒性,操作时请做好防护措施 |
Standard
|
| 4℃保存 |
2、标准曲线设置
按下表所示用去离子水将1mg/mL标准品稀释为0.25、0.1、0.05、0.025、0.0125、0.00625、0.003125 mg/mL的标准溶液。
| 序号 | 标准品体积
| 去离子水体积(μL)
| 浓度(mg/mL)
|
Std.1
| 100μL of 1mg/mL
| 300 | 0.25 |
Std.2
| 160μL of Std.1
| 240 | 0.1 |
Std.3
| 200μL of Std.2
| 200 | 0.05 |
Std.4
| 200μL of Std.3
| 200
| 0.025 |
Std.5
| 200μL of Std.4
| 200
| 0.0125 |
Std.6
| 200μL of Std.5
| 200
| 0.00625 |
Std.7
| 200μL of Std.6
| 200
| 0.003125 |
注意:每次实验都要做一次标准品检测,制作标曲;稀释后的标准品溶液不稳定,必须在4小时内使用。
3、样本制备
注意:推荐使用新鲜样本,如果不立即进行实验,样本可在-80°C保存1个月。
3.1 组织
称取0.1g样本,置于10mL试管中,加入0.75mL Extraction Buffer,置于沸水浴中煮沸20min(塞紧试管塞,防止水分蒸发),每5min振摇试管1次,充分混匀。待组织全部溶解后,取出试管冷却后去离子水定容到5mL,混匀,8,000g,25°C离心10min,取上清液待测。
3.2 细胞或细菌
收集500万细菌或细胞到EP管内,离心后弃上清,加入0.75mL Extraction Buffer超声波破碎细菌或细胞(功率200W,超声3s,间隔10s,重复30次);转移至10mL试管中,置于沸水浴中煮沸20min(塞紧试管塞,防止水分蒸发),每5min振摇试管1次,充分混匀。取出试管冷却后去离子水定容到5mL,混匀,8,000g,25°C离心10min,取上清液待测。
注意:如需测定蛋白浓度,推荐使用阿拉丁B665595 BCA蛋白定量试剂盒或R1491648 即用型BCA蛋白定量试剂盒。
4、实验步骤
4.1 酶标仪或可见分光光度计预热30min以上,调节波长到620nm,可见分光光度计用去离子水调零。
4.2 样本测定:在EP管中依次加入下列试剂:
试剂
| 空白管(μL)
| 标准管(μL)
| 测定管(μL)
|
样本
| 0
| 0
| 60
|
标准液
| 0
| 60
| 0
|
去离子水
| 60 | 0
| 0
|
Chromogen
| 240 | 240
| 240 |
4.3 混匀,置于95℃水浴10min(盖紧,防止水分蒸发),冷却,取200μL转移至96孔板或微量玻璃比色皿中,620nm波长处测定吸光值,分别记为A 空白 ,A 标准 ,A 测定 ,计算ΔA 测定 =A 测定 -A 空白 ,ΔA 标准 =A 标准 -A 空白 。
注意:实验之前建议选择2-3个预期差异大的样本做预实验。如果ΔA 测定 小于0.001可适当加大样本量。如果ΔA 测定 大于1.5,样本可用去离子水进一步稀释,计算结果乘以稀释倍数,或减少提取用样本量。
5、结果计算
注意:我们为您提供的计算公式,包括推导过程计算公式和简洁计算公式。两者完全相等。建议以加粗的简洁计算公式为最终计算公式。
5.1 标准曲线的绘制
以标准液浓度为y轴,ΔA 标准 为x轴,绘制标准曲线(浓度为y轴便于计算结果)。将ΔA 测定 代入x计算出y(mg/mL)。
5.2 样本糖原含量计算
(1) 按照样本质量计算
糖原(mg/g)=(y×V样)÷(W×V样÷V样总)÷1.11×n=4.5×y÷W×n
(2) 按照样本蛋白浓度计算
糖原(mg/mg prot)=(y×V样)÷(V样×Cpr)÷1.11×n=4.5×y÷Cpr×n
(3) 按照细菌或细胞数量计算
糖原(mg/10⁴)=(y×V样)÷(N×V样÷V样总)÷1.11×n=4.5×y÷N×n
糖原 (mg/mgprot) =1.11×(y×V 样 )÷(V 样 ×Cpr)×n=1.11×y÷Cpr×n
(3) 按照细菌或细胞数量
计算
糖原(mg/10⁴)=1.11×(y×V 样 )÷(细菌或细胞数量×V 样 ÷V 样总 )×n=5.55×y÷细菌或细胞数量×n
参数说明
1.11:是此法测得葡萄糖含量换算为糖原含量的常数,即100μg葡萄糖用蒽酮试剂显色相当于111μg糖原用蒽酮试剂所显之色;
V 样 :加入反应体系中待测样本体积,0.06mL;
W:样本质量,g;
V 样总 :样本总体积,5mL;
n:稀释倍数;
Cpr:样本蛋白质浓度,mg/mL;
细菌或细胞数量:以10⁴为单位,万个。
6、结果展示
典型标准曲线:y=0.1746x+0.0027,R²=0.9961

以下数据和曲线仅供参考,实验者需根据自己的实验建立标准曲线。
注意事项
1、正式检测前,建议选择2-3个预期差异较大的样本进行预实验。
2、本产品仅供科学研究使用,不适用于临床诊断。为了您的安全和健康,请穿实验服并戴一次性手套操作。
Glycogen is a macromolecular polysaccharide composed of glucose and serves as one of the primary storage forms of sugar. It is mainly stored in the liver and muscles as reserve energy, referred to as liver glycogen and muscle glycogen, respectively. Liver glycogen regulates blood glucose concentration; when blood sugar rises, glycogen can be synthesized in the liver, and when blood sugar decreases, liver glycogen is broken down into glucose to supplement blood sugar. Therefore, liver glycogen is crucial for maintaining the relative balance of blood glucose. Muscle glycogen is the storage form of sugar in muscles. During strenuous exercise that consumes large amounts of blood sugar, muscle glycogen cannot be directly broken down into blood sugar but must first decompose to produce lactic acid, which circulates to the liver via the bloodstream and is converted into liver glycogen and glucose through gluconeogenesis.
Detection Principle: Glycogen is extracted using a strong alkaline extraction buffer. Under strong acidic conditions, it forms a blue compound with the anthrone chromogen, which has a characteristic absorption peak at 620 nm. Within a certain concentration range, the glycogen content is linearly related to the absorbance at 620 nm. The glycogen content in the sample can be calculated based on the standard curve.
Detection Range: 0.003125 - 0.25 mg/mL
Sensitivity: 0.003125 mg/mL
Applicable Samples: Animal tissues, bacteria, cells
G1501748
| Component
| 96T
| Storage
|
G1501748A
| Extraction Buffer
| 120 mL
| 2-8℃
|
G1501748B
| Chromogen
| 1EA | 2-8℃. Store in the dark.
|
G1501748C
| Standard
| 1 mL | 2-8℃ |
Note: It is recommended to perform preliminary experiments using 2-3 samples expected to have significant differences before formal testing.
User-Provided Instruments and Consumables
1.Microplate reader or visible spectrophotometer (capable of measuring absorbance at 620 nm)
2.Low-temperature centrifuge, Water bath
3.96-well plate or micro glass cuvettes, Adjustable pipettes and tips, EP tubes
4.Deionized water, Concentrated sulfuric acid
Experimental Procedure
1. Reagent Preparation
Reagent Name
| Reagent Preparation
| Precautions
|
Extraction Buffer
| Ready-to-use; equilibrate to room temperature before use.
| Store at 4°C. Corrosive; please take protective measures during handling.
|
Chromogen
| First, dissolve the powder in 7.2 mL of deionized water. Then slowly add 28.8 mL of concentrated sulfuric acid. Mix thoroughly after complete dissolution.
| Store at 4°C protected from light; valid for one week. Toxic; please take protective measures during handling.
|
Standard
|
| Store at 4°C. |
2. Standard Curve Setup
Dilute the 1 mg/mL standard with deionized water to prepare standard solutions of 0.25, 0.1, 0.05, 0.025, 0.0125, 0.00625, and 0.003125 mg/mL as shown in the table below.
No.
| Standard Volume
| Deionized Water Volume (µL)
| Concentration (mg/mL)
|
Std.1
| 100μL of 1mg/mL
| 300 | 0.25 |
Std.2
| 160μL of Std.1
| 240 | 0.1 |
Std.3
| 200μL of Std.2
| 200 | 0.05 |
Std.4
| 200μL of Std.3
| 200
| 0.025 |
Std.5
| 200μL of Std.4
| 200
| 0.0125 |
Std.6
| 200μL of Std.5
| 200
| 0.00625 |
Std.7
| 200μL of Std.6
| 200
| 0.003125 |
Note: A standard curve must be prepared for each experiment. Diluted standard solutions are unstable and must be used within 4 hours.
3. Sample Preparation
Note: Fresh samples are recommended. If not used immediately, samples can be stored at -80°C for up to 1 month.
3.1 Tissues
Weigh 0.1 g of tissue and place it in a 10 mL test tube. Add 0.75 mL of Extraction Buffer. Boil in a water bath for 20 minutes (stopper the tube tightly to prevent water evaporation). Shake the tube every 5 minutes to mix thoroughly. After the tissue is completely dissolved, remove the tube and let it cool. Dilute to 5 mL with deionized water, mix well. Centrifuge at 8,000 g, 25°C for 10 minutes. Collect the supernatant for detection.
3.2 Cells or Bacteria
Collect 5 million bacteria or cells into an EP tube. Centrifuge and discard the supernatant. Add 0.75 mL of Extraction Buffer and disrupt the bacteria or cells by ultrasonication (power 200 W, ultrasonicate for 3 s, interval 10 s, repeat 30 times). Transfer to a 10 mL test tube. Boil in a water bath for 20 minutes (stopper the tube tightly to prevent water evaporation). Shake the tube every 5 minutes to mix thoroughly. Remove the tube and let it cool. Dilute to 5 mL with deionized water, mix well. Centrifuge at 8,000 g, 25°C for 10 minutes. Collect the supernatant for detection.
Note: For protein concentration determination, Aladdin BCA Protein Quantification Kit (B665595) or Ready-to-Use BCA Protein Quantification Kit (R1491648) are recommended.
4. Assay Steps
4.1 Instrument Preparation: Preheat the microplate reader or visible spectrophotometer for at least 30 minutes. Set the wavelength to 620 nm. For visible spectrophotometers, zero the instrument with deionized water.
4.2 Sample Assay: Add reagents sequentially to EP tubes as follows:
Reagent
| Blank Tube (µL)
| Standard Tube (µL)
| Test Tube (µL)
|
Sample
| 0
| 0
| 60
|
Standard
| 0
| 60
| 0
|
| Deionized Water | 60 | 0
| 0
|
Chromogen
| 240 | 240
| 240 |
4.3 Mix well. Incubate in a 95°C water bath for 10 minutes (cap tightly to prevent evaporation). Cool. Transfer 200 µL to a 96-well plate or micro glass cuvette. Measure the absorbance at 620 nm, recorded as A blank , A standard , and A test . Calculate ΔA test = A test - A blank and ΔA standard = A standard - A blank .
Note: It is recommended to perform preliminary experiments with 2-3 samples expected to have significant differences before formal testing. If ΔA test is less than 0.001, appropriately increase the sample amount. If ΔA test is greater than 1.5, dilute the sample further with deionized water (multiply the result by the dilution factor) or reduce the amount of sample used for extraction.
5. Result Calculation
Note: We provide both derived and simplified calculation formulas, which are equivalent. The simplified formulas in bold are recommended as the final calculation formulas.
5.1 Standard Curve Plotting
Plot the standard curve with standard concentration as the y-axis and ΔA standard as the x-axis (using concentration as the y-axis facilitates calculation). Substitute ΔA test into x to calculate y (mg/mL).
5.2 Sample Glycogen Content Calculation
(1) Based on sample mass:
Glycogen (mg/g) = (y × Vsample) ÷ (W × Vsample ÷ Vtotal) ÷ 1.11 × n = 4.5 × y ÷ W × n
(2) Based on sample protein concentration:
Glycogen (mg/mg prot) = (y × Vsample) ÷ (Vsample × Cpr) ÷ 1.11 × n = 4.5 × y ÷ Cpr × n
(3) Based on bacterial or cell count:
Glycogen (mg/10⁴) = (y × Vsample) ÷ (N × Vsample ÷ Vtotal) ÷ 1.11 × n = 4.5 × y ÷ N × n
Parameter Description:
1.11: Constant for converting glucose content measured by this method to glycogen content (i.e., 100 µg glucose color developed with anthrone reagent is equivalent to that of 111 µg glycogen).
V sample : Volume of test sample added to the reaction system, 0.06 mL.
W: Sample mass, g.
V total : Total volume of the sample extract, 5 mL.
n: Dilution factor.
Cpr: Sample protein concentration, mg/mL.
Bacterial or Cell Count: In units of 10⁴ (ten thousands)
6. Result Presentation
Typical Standard Curve: y = 0.1746x + 0.0027, R² = 0.9961
(The following data and curve are for reference only; users must establish their own standard curve based on their experiment.)
Precautions
1. It is recommended to perform preliminary experiments using 2-3 samples expected to have significant differences before formal testing.
2. This product is for scientific research use only and is not intended for clinical diagnosis. For your safety and health, please wear a lab coat and disposable gloves during operation.

 ZJ25F1029232


 危险品化学品经营许可证(带存储)