土壤中的酚类物质主要由植物释放,以及植物残体和凋落物分解产生。由于酚类物质的难降解性,其在土壤中的积累会影响土壤的碳氮转化和温室气体排放,进而会使土壤肥力衰退。另外,酚类物质对土壤有机质矿化和养分循环也有着重要影响。本试剂盒采用福林酚法测定土壤中酚类物质含量,在碱性条件下,酚类物质将钨钼酸还原,产生蓝色化合物,在750 nm处有特征吸收峰,通过检测在750 nm处的吸光值,进而计算土壤中酚类物质含量。
组份表:
| S1521999 | 组件 | 物理外观 | 48T | 储存 | 单次测试使用量 | | S1521999A | 提取液 | 无色透明液体 | 60 mL | 2-8℃. 避光 | 每次反应需使用1 mL | | S1521999B | 试剂一 | 黄色液体 | 25 mL | 2-8℃. 避光 | 每次反应需使用450 μL | | S1521999C | 试剂二 | 无色透明液体 | 5 mL | 2-8℃ | 每次反应需使用90 μL | | S1521999D | 标准品 | 白色粉末 | 10 mg | 2-8℃ | 按照需求使用 |
|
所需的仪器和用品:
可见分光光度计、1 mL玻璃比色皿(光径0.4 cm)、可调式移液器、天平、离心机。
土壤总酚含量的测定:
建议正式实验前选取2个样本做预测定,了解本批样品情况,熟悉实验流程,避免实验样本和试剂浪费!
1. 样本制备:
称取约0.5 g土壤样本,加入1 mL提取液,室温振荡提取30 min。25℃×8000 rpm,离心10 min,取上清待测。
2. 上机检测:
(1) 可见分光光度计预热30 min,调节波长至750 nm,蒸馏水调零。
(2) 在EP管中依次加入:
| 试剂名称(μL) | 测定管 | 空白管(仅做一次) | | 样本 | 180 | - | | 蒸馏水 | - | 180 | | 试剂一 | 450 | 450 | | 试剂二 | 90 | 90 | 混匀,25℃室温静置30 min,全部液体转移至1 mL玻璃比色
皿(光径0.4 cm)中,测定750 nm吸光值A,△A=A<sub>测定</sub>-A A<sub>空白</sub> |
|
【注】:
1. 吸光值大于1.2,上清液用蒸馏水适当稀释再测定,计算公式里乘以稀释倍数D。
2. 若△A在零附近,可增加土壤取样质量W,或加大样本上样量V1(如增至300 μL,则试剂一相应减少,保持总体积不变),则改变后W和V1需代入计算公式重新计算。
结果计算:
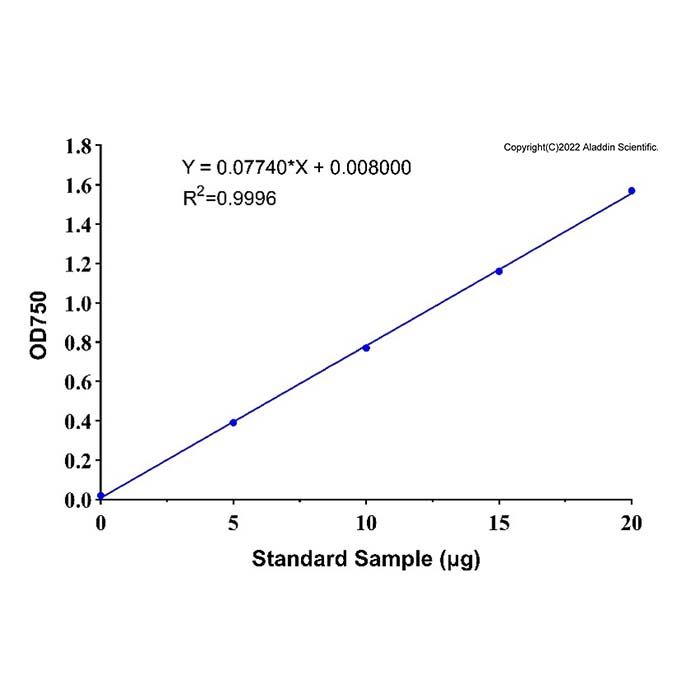
1. 标准曲线:Y=0.07740*X+0.008000,X是标准品质量(μg),Y是∆A。

2. 土壤总酚含量(μg/g土壤)=(∆A-0.008000)÷0.07740÷(V1÷V×W)×D
V---加入提取液体积,1 mL;
D---稀释倍数,未稀释即为1;
V1---反应中样品体积,0.18 mL;
W---土壤取样质量,g。
附 标准曲线制作过程:
1. 制备标准品母液(10 mg/mL):向标准品EP管里面加入1 mL蒸馏水,超声完全溶解。
2. 把标准品母液用蒸馏水稀释成1 mg/mL的标准品稀释液,再根据下表操作,稀释成相应的标准品稀释液,上样180 μL时即为相应标准曲线的上样量。
操作表:
| ① | ② | ③ | ④ | | 目标上样量 (μg) | 5 | 10 | 15 | 20 | | 1 mg/mL标准品稀释液(μL) | 20 | 40 | 60 | 80 | | 蒸馏水(μL) | 700 | 680 | 660 | 640 |
|
3. 依据测定管的加样体系操作,根据结果即可制作标准曲线。
The phenolic substances in the soil are mainly released by plants and produced by the decomposition of plant residues and fallen leaves. Due to the difficulty in their degradation, the accumulation of phenolic substances in the soil can affect the carbon-nitrogen transformation and greenhouse gas emissions of the soil, thereby causing a decline in soil fertility. Back. In addition, phenolic substances also have significant effects on the mineralization of soil organic matter and the nutrient cycle. This kit uses the Folin phenol method to determine the content of phenolic substances in the soil. Under alkaline conditions, phenolic substances will reduce tungsten molybdate, generating a blue compound. There is a characteristic absorption peak at 750 nm. By detecting the absorbance value at 750 nm, the content of phenolic substances in the soil can be calculated.
Components:
| S1521999 | Components | Appearance | 48T | Storage | Quantity Per Test | | S1521999A | Extraction Solution
| Colorless clear liquid | 60 mL | 2-8℃. Store in the dark | 1 mL for 1 reaction | | S1521999B | Reagent 1 | Yellow liquid | 25 mL | 2-8℃. Store in the dark | 450 μL for 1 reaction | | S1521999C | Reagent 2 | Colorless clear liquid | 5 mL | 2-8℃ | 90 μL for 1 reaction | | S1521999D | Standard Sample | White powder | 10 mg | 2-8℃ | Use as per requirements |
|
Required instruments and supplies:
Visible spectrophotometer, 1 mL glass cuvette (with a path length of 0.4 cm), adjustable pipette, balance, centrifuge.
Determination of total phenolic content in soil:
It is recommended to select 2 samples for prediction before the formal experiment. This will help us understand the situation of this batch of samples, familiarize ourselves with the experimental process, and avoid waste of experimental samples and reagents!
1. Sample preparation:
Take approximately 0.5 g of soil sample, add 1 mL of extraction solution, and shake at room temperature for 30 minutes. Centrifuge at 25℃ and 8000 rpm for 10 minutes, then take the supernatant for testing.
2. Machine testing:
(1) The spectrophotometer was preheated for 30 minutes, the wavelength was adjusted to 750 nm, and distilled water was used for zero adjustment.
(2) Add the following substances in sequence to the EP tube:
| Reagent Name (μL) | Testing tube | Blank tube (used only once) | | Sample | 180 | | Distilled water | - | 180 | | Reagent 1 | 450 | 450 | | Reagent 2 | 90 | 90 | | Mix well, let it stand at room temperature (25℃) for 30 minutes. Transfer all the liquid to a 1 mL glass cuvette (with a path length of 0.4 cm). Measure the absorbance at 750 nm as A, and calculate △A = A<sub>(measured)</sub> - A<sub>(blank)</sub> |
|
|
|
[Note]:
1. If absorbance ΔA > 1.2, dilute the supernatant with distilled water before re-testing; multiply the final result by dilution factor D during calculation.
2. If ΔA is close to zero, increase soil sample mass W or raise sample loading volume V₁ (e.g., increase to 300 μL; reduce Reagent I volume accordingly to maintain total reaction volume). Substitute the adjusted W and V₁ into the calculation formula for result computation.
Result Calculation:
1. Standard curve: Y = 0.07740* X + 0.008000, where X represents the mass of the standard sample (in μg) and Y represents ΔA.
2. Total phenol content in soil (μg/g soil) = (∆A - 0.008000) ÷ 0.07740 ÷ (V1 ÷ V × W) × D
V---Volume of the extracted liquid, 1 mL;
D---Dilution factor, 1 for undiluted sample;
V1---Volume of the sample in the reaction, 0.18 mL;
W---Mass of soil sample, g.
Appendix Procedure for preparing the standard curve:
1. Prepare standard stock solution (10 mg/mL): Add 1 mL distilled water to the standard powder vial, sonicate until fully dissolved.
2. Dilute the standard stock solution with distilled water to obtain a 1 mg/mL standard dilution. Then, follow the procedures in the table below to dilute it to the corresponding standard dilution. When 180 μL is used for sample loading, this will be the loading volume for the corresponding standard curve.
Operation Table:
| ① | ② | ③ | ④ | | Target loading amount (μg) | 5 | 10 | 15 | 20 | | 1 mg/mL standard dilution solution (μL) | 20 | 40 | 60 | 80 | | Distilled water (μL) | 700 | 680 | 660 | 640 |
|
3. Operate following the pipetting protocol for test tubes above, then plot the standard curve using recorded absorbance values.

 ZJ26F0838523


 危险品化学品经营许可证(带存储)