过氧化氢(H₂O₂)是生物体内最常见的活性氧分子,是一种活性氧代谢的副产物,主要由SOD和XOD 等催化产生,由 CAT 和 POD 等催化降解。过氧化氢不仅是重要的活性氧之一,也是活性氧相互转化的枢纽。一方面,H₂O₂可以直接或间接地氧化细胞内核酸,蛋白质等生物大分子,使细胞膜遭受损害,从而加速细胞的衰老和解体;另一方面,H₂O₂也是许多氧化应急反应中的关键调节因子。H₂O₂可以激活NF-κB 等因子,这些过氧化氢相关的信号途径和哮喘、炎症性关节炎、动脉硬化以及神经退行性疾病等许多疾病相关。H₂O₂也和细胞凋亡、细胞增殖等密切相关。
检测原理:利用H₂O₂氧化二价铁离子产生三价铁离子,然后和xylenol orange(二甲酚橙)在特定的溶液中形成紫色的产物,在580nm的OD值与H₂O₂浓度成正比,从而实现对H₂O₂浓度的测定。
检测范围:1-100 μM
灵敏度:1 μM
适用样本:动植物组织、细胞、细菌、血清(浆)、尿液
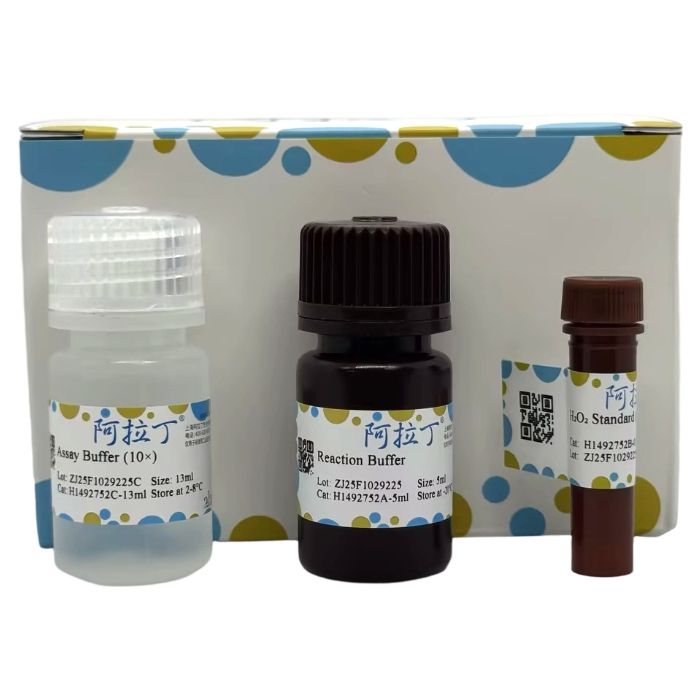
H1492752
| Component
| 96T | 480T | Storage
|
H1492752A
| Reaction Buffer
| 5 mL
| 25 mL
| -20℃. Store in the dark.
|
H1492752B
| H₂O₂ Standard (1M)
| 0.1 mL
| 0.1 mL
| -20℃. Store in the dark.
|
H1492752C
| Assay Buffer (10×)
| 13 mL
| 65 mL
| 2-8℃ |
请在实验前检查各组分的量。
各组分在规格基础上额外提供10%的量用于进行标准曲线制作或预实验。
自备仪器和试剂
自备资源类型
| 资源名称
| 备注 |
仪器
| 酶标仪
| 能测580nm处的吸光度
|
| 耗材 | 96 孔酶标板/超滤管
| 普通透明板/10kDa超滤管
|
| 试剂 | PBS (pH7.4) /去离子水/30% ZnSO₄溶液
| 清洗细胞(菌)用/试剂配制用/去除蛋白
|
| 其他 | 匀浆器(组织样本)、恒温箱、冰盒、低温离心机、 可调节式移液枪及枪头
| 检测量较大时合理使用多通道移液器有助于提高实验效率
|
实验流程
1、试剂准备
试剂名称
| 试剂准备
| 注意事项
|
Reaction Buffer
| 即用型;使用前平衡到室温
| 实验过程中避光放置;分装后-20℃避光保存
|
H₂O₂ Standard (1M)
| 即用型;使用前平衡到室温
| 实验过程中避光放置;分装后-20℃避光保存
|
Assay Buffer (1×)
| 使用前平衡到室温;
Assay Buffer (10×) 用去离子水1:10 稀释后作为工作液
| 稀释后可在4℃保存至少2个月,用来稀释H₂O₂标准品和样本
|
2、标准品配制
标准曲线设置:先配制2mM H₂O₂ Standard:2μL 1M 的H₂O₂ Standard用998μL的Assay Buffer (1×) 稀释;再配制100μM H₂O₂ Standard:50µL 2mM 的H₂O₂ Standard用950μL的Assay Buffer (1×) 稀释。100μM H₂O₂ Standard,按照下表所示,进一步稀释标准品。每次实验,请使用新配制的标准品;配制好的标准品需要在4h之内使用。如果样本是细胞悬浮液,建议使用培养基配制H₂O₂标准品。
标准品工作液
| 100µM Standard (μL)
| Assay Buffer (1×) (μL) | 浓度 (µM)
|
| 1 | 200
| 0 | 100 |
| 2 | 100 | 100 | 50 |
| 3 | 40 | 160 | 20 |
| 4 | 20 | 180 | 10 |
| 5 | 10 | 190 | 5 |
| 6 | 4 | 196 | 2 |
| 7 | 2 | 198 | 1 |
| 空白 | 0 | 200 | 0 |
3、样本制备
注意:推荐使用新鲜样本,如果不立即进行实验,样本可在-80℃保存1个月。当准备好进行该项实验时,将样本从-80℃拿出后,冰上解冻,但是请注意,这可能会影响样本的稳定性,实验结果可能会低于预期。如下物质会干扰检测结果,样本中应避免存在:Ferric salts,iron salts,sucrose,glucose,ascorbic acid,SDS (>0.2%),sodium azide。
3.1 动物组织:
用冷的PBS清洗组织,尽可能去除血液。吸干组织上的水分,称取0.1g,加入1mL预冷的 Assay Buffer (1×),将样本冰浴匀浆。10000g,4℃离心5min,取上清液置冰上待测。
3.2 植物组织:
称取约0.1g样本,加入1mL预冷的Assay Buffer (1×) 捣碎,冰浴超声破碎5min(功率20%或200W,超声3s,间隔7s,重复30次),10000g,4℃离心5min,取上清液置冰上待测。
3.3 细胞(菌):
收集5×10⁶ 个细胞或细菌,用冷PBS清洗细胞或细菌后,加入1mL预冷的Assay Buffer (1×) 冰浴匀浆或冰浴超声破碎5min(功率20%或200W,超声3s,间隔7s,重复30次)。10000g,4℃离心5min,取上清液置冰上待测。
3.4 血浆、血清和尿液(和其他生物体液):
去除蛋白后,取上清。去除蛋白的方式:可使用10kDa的超滤管过滤后取滤液或是将样本:30% ZnSO₄溶液=20:1进行混合后涡旋,再10000g室温离心5min,取上清。
4、实验步骤
4.1 酶标仪准备:预热30min以上,调节波长到580nm。
4.2 检测体系配制:
试剂
| 标准孔(μL)
| 测定孔(μL)
|
不同浓度标准品
| 60 | 0 |
样本
| 0 | 60
|
Reaction Buffer
| 40 | 40
|
4.3 反应体系充分混匀后在37℃孵育10min。
4.4 吸光度检测:在580nm处读取吸光度值,分别标记为A 空白 、A 标准 和A 测定 。
5、结果计算
以下为您提供的推导过程计算公式和简洁计算公式,两者完全相等。
5.1 数据处理
计算ΔA 标准 =A 标准 -A 空白 ,ΔA 测定 =A 测定 -A 空白 。
5.2 标准曲线绘制
以标准品浓度为y轴,ΔA 标准 为x轴,绘制标准曲线。将ΔA测定代入方程得到y值 (µM)。
5.3 样本H₂O₂浓度计算
(1) 按样本质量计算
H₂O₂含量 (nmol/g 鲜重)=y×V 样 ÷(W×V 样 ÷V 样总 )×n=y÷W×n
(2) 按细胞或细菌数量计算
H₂O₂含量 (nmol/10⁴)=y×V样÷(500×V样 ÷V 样总 )×n=y÷500×n
(3) 按液体体积计算
H₂O₂含量 (nmol/mL)=y×V 样 ÷V 样 ×n=y×n
参数说明
nmol:1 μM=1 nmol/mL;
V 样 :加入样本体积;
V 样总 :加入Assay Buffer (1×) 体积,1mL;
n:样本稀释倍数;
W:样本质量,g;
500:细胞或细菌数量,以10⁴为单位。
6、结果展示
典型标准曲线:y=207.21x+1.4921, R²=0.9988

示例-1:取0.1g玉米组织,按照测定步骤操作,用96孔板进行检测。测得ΔA 测定 =A 测定 -A 空白 =0.278-0.048=0.230, 代入标准曲线,计算y=49.15。按样本质量计算得:H₂O₂含量(nmol/g)=y×V 样 ÷(W×V 样 ÷V 样总 )×n=y÷W×n=491.5 nmol/g。
注意事项
1、正式检测前,建议选择2-3个预期差异较大的样本进行预实验。
2、本试剂盒兼容分光光度计检测,请按照分光光度计检测要求按比例调节检测试剂配制量。
3、建议实验者自行建立标准曲线以提高结果准确度。如未自行建立标准曲线,可参考结果展示部分的典型标准曲线公式进行结果计算。
4、生化检测试剂普遍具有刺激性、生物毒性等,为了您的安全和健康,请在实验全程做好生物安全防护,穿戴实验服、口罩、手套、头套等安全护具,在通风橱、生物安全柜中进行实验。
5、本产品仅供科学研究使用,不适用于临床诊断。
常见问题及解答
Q:检测得到的样本ΔA测定过高或者过低怎么办?
A:如果样本ΔA 测定 >浓度为100µM标准品的ΔA标准,则说明样本H₂O₂含量太高,需用Assay Buffer (1×) 适当稀释(计算公式中乘以相应稀释倍数)。如果样本的ΔA 测定 <0.005,可提高样本量。
Hydrogen peroxide (H₂O₂) is the most common reactive oxygen species (ROS) in living organisms. It is a by-product of active oxygen metabolism, primarily produced by enzymes like SOD and XOD, and degraded by enzymes such as CAT and POD. H₂O₂ is not only a significant ROS but also a hub for the interconversion of reactive oxygen species. On one hand, H₂O₂ can directly or indirectly oxidize biological macromolecules like nucleic acids and proteins within cells, damaging cell membranes and thereby accelerating cellular aging and disintegration. On the other hand, H₂O₂ is also a key regulatory factor in many oxidative stress responses. It can activate factors like NF-κB, and these H₂O₂-related signaling pathways are associated with many diseases such as asthma, inflammatory arthritis, arteriosclerosis, and neurodegenerative diseases. H₂O₂ is also closely related to processes like cell apoptosis and proliferation.
Detection Principle: H₂O₂ oxidizes ferrous ions (Fe²⁺) to ferric ions (Fe³⁺). The Fe³⁺ then forms a purple complex with xylenol orange in a specific solution. The absorbance at 580 nm is directly proportional to the H₂O₂ concentration, allowing for the quantification of H₂O₂ levels.
Detection Range: 1-100 µM
Sensitivity: 1 µM
Applicable Samples: Animal/plant tissues, cells, bacteria, serum (plasma), urine.
H1492752
| Component
| 96T | 480T | Storage
|
H1492752A
| Reaction Buffer
| 5 mL
| 25 mL
| -20℃. Store in the dark.
|
H1492752B
| H₂O₂ Standard (1M)
| 0.1 mL
| 0.1 mL
| -20℃. Store in the dark.
|
H1492752C
| Assay Buffer (10×)
| 13 mL
| 65 mL
| 2-8℃ |
Please check the quantity of each component before the experiment.
An additional 10% of each component is provided beyond the specified volume for standard curve preparation or preliminary experiments.
User-Provided Instruments and Reagents
Type
| Name
| Notes |
Instrument
| Microplate Reader
| Capable of measuring absorbance at 580 nm.
|
| Consumables | 96-well Microplate / Ultrafiltration tubes
| Standard transparent plate / 10 kDa MWCO
|
| Reagents | PBS (pH 7.4) / Deionized Water / 30% ZnSO₄ solution
| For washing cells/bacteria / Reagent preparation / Protein removal
|
| Others | Homogenizer (for tissue samples), incubator, ice bucket, low-temperature centrifuge, adjustable pipettes and tips
| Using a multichannel pipette for large-scale detection can improve efficiency.
|
Experimental Procedure
1. Reagent Preparation
Reagent Name
| Reagent Preparation
| Precautions
|
Reaction Buffer
| Ready-to-use; equilibrate to room temperature before use.
| Protect from light during the experiment; aliquot and store at -20°C in the dark.
|
H₂O₂ Standard (1M)
| Ready-to-use; equilibrate to room temperature before use.
| Protect from light during the experiment; aliquot and store at -20°C in the dark.
|
Assay Buffer (1×)
| Dilute the 10× Assay Buffer 1:10 with deionized water before use; equilibrate to room temperature.
| The diluted buffer can be stored at 4°C for at least 2 months. Used for diluting H₂O₂ standard and samples.
|
2. Standard Preparation
Standard Curve Setup:
First, prepare a 2 mM H₂O₂ Standard: Dilute 2 µL of the 1M H₂O₂ Standard with 998 µL of Assay Buffer (1×).
Then, prepare a 100 µM H₂O₂ Standard: Dilute 50 µL of the 2 mM H₂O₂ Standard with 950 µL of Assay Buffer (1×).
Using the 100 µM H₂O₂ Standard, prepare further dilutions as shown in the table below.
Prepare fresh standard solutions for each experiment.
Prepared standards must be used within 4 hours.
If the sample is a cell suspension, it is recommended to prepare the H₂O₂ standards using the culture medium.
Standard Working Solution
| 100µM Standard (μL)
| Assay Buffer (1×) (μL) | Concentration (µM)
|
| 1 | 200
| 0 | 100 |
| 2 | 100 | 100 | 50 |
| 3 | 40 | 160 | 20 |
| 4 | 20 | 180 | 10 |
| 5 | 10 | 190 | 5 |
| 6 | 4 | 196 | 2 |
| 7 | 2 | 198 | 1 |
Blank
| 0 | 200 | 0 |
3. Sample Preparation
Note: Fresh samples are recommended. If not used immediately, samples can be stored at -80°C for up to 1 month. When ready for the experiment, thaw samples on ice. Note that this may affect sample stability, and results might be lower than expected. The following substances interfere with detection and should be avoided in samples: Ferric salts, iron salts, sucrose, glucose, ascorbic acid, SDS (>0.2%), sodium azide.
3.1 Animal Tissues:
Wash the tissue with cold PBS to remove as much blood as possible. Blot dry, weigh 0.1 g, and add 1 mL of pre-cooled Assay Buffer (1×). Homogenize the sample on ice. Centrifuge at 10000 g, 4°C for 5 min. Collect the supernatant and keep on ice for detection.
3.2 Plant Tissues:
Weigh approximately 0.1 g of sample, add 1 mL of pre-cooled Assay Buffer (1×), and grind. Disrupt by ultrasound on ice (power 20% or 200 W, ultrasonicate for 3 s, interval 7 s, repeat 30 times). Centrifuge at 10000 g, 4°C for 5 min. Collect the supernatant and keep on ice for detection.
3.3 Cells/Bacteria:
Collect 5×10⁶ cells or bacteria. Wash with cold PBS, then add 1 mL of pre-cooled Assay Buffer (1×). Homogenize on ice or disrupt by ultrasound on ice (power 20% or 200 W, ultrasonicate for 3 s, interval 7 s, repeat 30 times). Centrifuge at 10000 g, 4°C for 5 min. Collect the supernatant and keep on ice for detection.
3.4 Plasma, Serum, and Urine (and other biological fluids):
Remove proteins and use the supernatant. Protein removal methods:
Use a 10 kDa ultrafiltration tube: filter and collect the filtrate.
Mix sample : 30% ZnSO₄ solution = 20 : 1, vortex, then centrifuge at 10000 g, room temperature for 5 min, and collect the supernatant.
4. Assay Steps
4.1 Microplate Reader Preparation: Preheat for at least 30 minutes, set wavelength to 580 nm.
4.2 Assay System Setup:
Reagent
| Standard Well (μL)
| Test Well (μL)
|
| Standard (various conc.) | 60 | 0 |
Sample
| 0 | 60
|
Reaction Buffer
| 40 | 40
|
4.3 Mix the reaction system thoroughly and incubate at 37°C for 10 minutes.
4.4 Absorbance Measurement: Read the absorbance at 580 nm, recorded as A blank , A standard , and A test .
5. Result Calculation
The following provides both the derived formula and the simplified calculation formula, which are completely equivalent.
5.1 Data Processing
Calculate ΔA standard = A standard - A blank , ΔA test = A test - A blank .
5.2 Standard Curve Plotting
Plot the standard curve with standard concentration as the y-axis and ΔA <sub> standard </sub> as the x-axis. Substitute ΔA <sub> test </sub> into the equation to obtain the y value (µM).
5.3 Sample H₂O₂ Concentration Calculation
(1) Based on sample mass:
H₂O₂ Content (nmol/g fresh weight) = y × V sample ÷ (W × V sample ÷ V total ) × n = y ÷ W × n
(2) Based on cell or bacterial count:
H₂O₂ Content (nmol/10⁴ cells) = y × V sample ÷ (500 × V sample ÷ V total ) × n = y ÷ 500 × n
(3) Based on liquid volume:
H₂O₂ Content (nmol/mL) = y × V sample ÷ V sample × n = y × n
Parameter Description:
1 µM = 1 nmol/mL;
V sample : Volume of sample added;
V total : Volume of Assay Buffer (1×) added, 1 mL;
n: Sample dilution factor;
W: Sample mass, g;
500: Cell or bacterial count, in units of 10⁴.
6. Result Presentation
Typical Standard Curve: y = 207.21x + 1.4921, R² = 0.9988

Example-1: 0.1 g of corn tissue was processed and assayed according to the procedure using a 96-well plate.
Measured: ΔA test = A test - A blank = 0.278 - 0.048 = 0.230
Substituting into the standard curve gives y = 49.15 µM.
Calculated based on sample mass:
H₂O₂ Content (nmol/g) = y ÷ W × n = 491.5 nmol/g.
Precautions
1. It is recommended to perform preliminary experiments using 2-3 samples expected to have significant differences before formal testing.
2. This kit is compatible with spectrophotometer detection. Adjust the preparation volume of detection reagents proportionally according to the spectrophotometer's requirements.
3. It is recommended to establish your own standard curve for improved accuracy. If not, you may refer to the typical standard curve formula provided in the results section for calculation.
4. Biochemical reagents are generally irritating and biologically toxic. For your safety and health, please wear appropriate personal protective equipment (lab coat, mask, gloves, hair cap, etc.) throughout the experiment and perform experiments in a fume hood or biosafety cabinet.
5. This product is for scientific research use only. Not intended for clinical diagnosis.
Frequently Asked Questions
Q: What should I do if the sample ΔA <sub> test </sub> is too high or too low?
A: If the sample ΔA test is greater than the ΔA standard of the 100 µM standard, the H₂O₂ content in the sample is too high. Dilute the sample appropriately with Assay Buffer (1×) (multiply by the dilution factor in the calculation). If the sample ΔA test is less than 0.005, increase the sample amount.

 J2622111


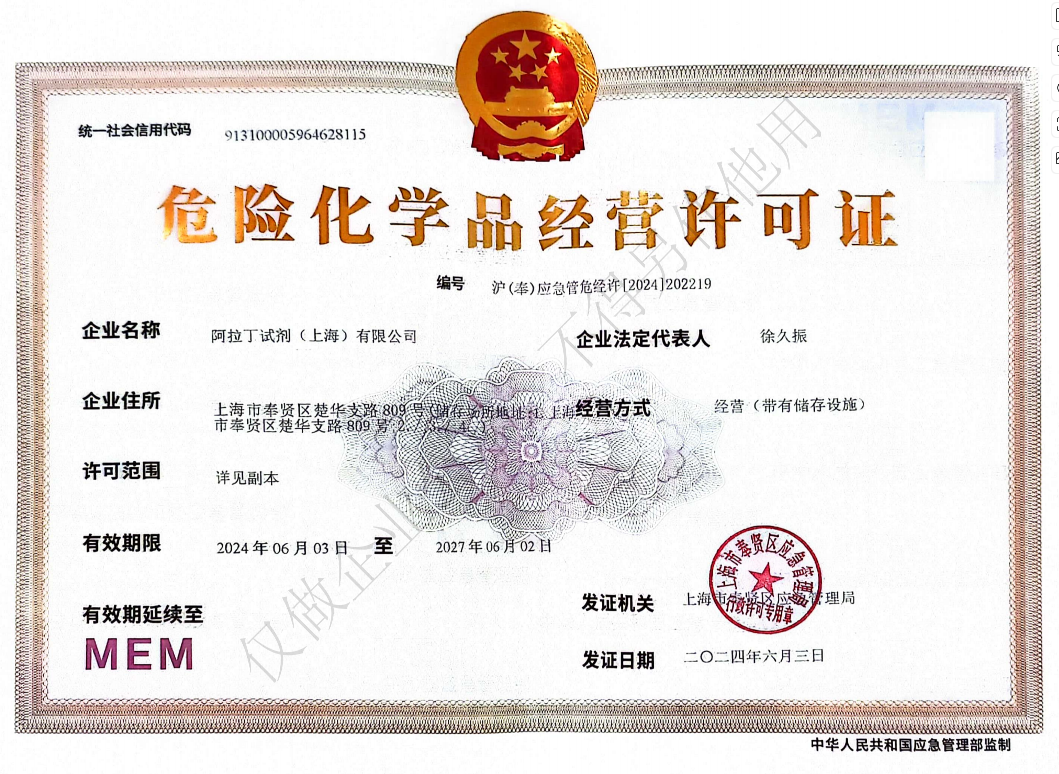 危险品化学品经营许可证(带存储)