
计算溶液所需的质量、体积或浓度。
为什么选择此级别
,适用于对基线干扰要求严格的色谱和分析工作流程。
储存与运输
2-8°C储存,避光。低温运输 。请查阅批次 COA 获取详细规格。
质量文档
SDS、COA、产品数据表及规格说明书均可下载。可通过批号查询获取批次 COA。
文献证明
在色谱分析、有机合成和交叉偶联反应领域已被 0 篇同行评审文献引用。
概述
亚硝酸盐广泛存在于水体和土壤中,不仅是有机氮分解的重要中间产物,也可能来自污染。人体摄入过量后,可诱发消化系统癌变。
检测原理:在酸性条件下,亚硝酸盐与对氨基苯磺酸反应生成重氮化合物,再与N-1-萘基乙二胺形成紫红色偶氮化合物,在540 nm处有特征吸收峰。
适用样本:水样、土壤样本注意:正式检测前,建议选择2-3个预期差异较大的样本进行预实验。
自备仪器和试剂
- 酶标仪或可见分光光度计(能测540nm处的吸光度)
- 96孔板或微量玻璃比色皿、可调节式移液枪及枪头
- 制冰机、离心机、2mm筛网
- 去离子水
操作步骤
1、试剂准备
| 试剂名称 | 试剂准备 | 注意事项 |
| Reagent Ⅰ | 即用型,使用前平衡到室温 | 4℃保存 |
| Reagent Ⅱ | 即用型,使用前平衡到室温 | 4℃避光保存 |
| Reagent Ⅲ | 即用型,使用前平衡到室温 | 4℃避光保存 |
注:Reagent Ⅲ和Standard有一定毒性,建议在通风橱进行实验。
2、标准曲线设置
用Reagent Ⅰ将1 mmol/mL Standard稀释成10 μmol/mL。按下表所示,用Reagent Ⅰ将10 μmol/mL标准品稀释至100、50、25、12.5、6.25、3.125、1.5625 nmoL/mL。
| 序号 | 标准品体积 | Reagent Ⅰ体积(µL) | 标准品浓度(nmol/mL) |
| Std.1 | 10µL of 10 μmol/mL Standard | 990 | 100 |
| Std.2 | 100µL of Std.1 (100 nmol/mL) | 100 | 50 |
| Std.3 | 100µL of Std.2 (50 nmol/mL) | 100 | 25 |
| Std.4 | 100µL of Std.3 (25 nmol/mL) | 100 | 12.5 |
| Std.5 | 100µL of Std.4 (12.5 nmol/mL) | 100 | 6.25 |
| Std.6 | 100µL of Std.5 (6.25 nmol/mL) | 100 | 3.125 |
| Std.7 | 100µL of Std.6 (3.125 nmol/mL) | 100 | 1.5625 |
注意:每次实验都要做一次标准品检测,制作标曲;稀释后的标准品溶液不稳定,必须在4小时内使用。
3、样本制备
3.1 土壤样品:取适量土壤样品,去除石块、树枝等杂质,过2mm筛网,准确称取0.5g,加入1mL Reagent Ⅰ,室温震荡1h,8,000g,25℃离心15min,取上清液待测。
3.2 水样:直接检测;如果浑浊,可以离心后再测定。
4、实验步骤
4.1 酶标仪或可见分光光度计预热30min,调节波长到540nm。可见分光光度计用去离子水调零。
4.2 操作表(下述操作在96孔板或微量玻璃比色皿中操作):
| 试剂(μL) | 空白孔 | 标准孔 | 测定孔 |
| Reagent Ⅰ | 70 | 0 | 0 |
| Standard | 0 | 70 | 0 |
| 样本 | 0 | 0 | 70 |
| Reagent Ⅱ | 65 | 65 | 65 |
| Reagent Ⅲ | 65 | 65 | 65 |
4.3 迅速混匀后,25℃静置15min,540nm测定吸光值,记为A空白、A标准、A测定,计算ΔA测=A测定-A空白、ΔA标=A标准-A空白。
注意:空白孔和标准孔只需测定1次。实验之前建议选择2-3个预期差异大的样本做预实验。如果ΔA测小于0.001,可适当加大样本量。如果ΔA测大于2.0,样本可用Reagent Ⅰ进一步稀释,计算结果乘以稀释倍数,或减少提取用样本量。
5、结果计算
注意:我们为您提供的计算公式,包括推导过程计算公式和简洁计算公式。两者完全相等。建议以加粗的简洁计算公式为最终计算公式。
5.1 标准曲线的绘制
以标准液浓度为y轴,ΔA标为x轴绘制标准曲线。将ΔA测代入标准曲线公式计算出y(nmol/mL)。
5.2 样本亚硝酸盐含量计算
(1) 土壤样品
NO₂⁻ (nmol/g)=y×V样×V总÷V样÷W×n=2y×n
(2) 水样
NO₂⁻ (nmol/mL)=y×n=y×n
参数说明:
V样:样本体积,0.07mL;
W:样本质量,0.5g;
V总,加入Reagent Ⅰ的体积,1mL;
n:样本的稀释倍数。
6、结果展示
6.1 典型标准曲线
y=89.365x-0.918,R²=0.999

图1:NO₂⁻标准曲线
6.2 实验实例

图2:试剂盒测定土壤中NO₂⁻的含量
注意事项
本产品仅供科学研究使用,不适用于临床诊断。为了您的安全和健康,请穿实验服并戴一次性手套操作。
Nitrite is widely present in water bodies and soil, serving not only as an important intermediate product of organic nitrogen decomposition but also potentially originating from pollution. Excessive intake by humans can induce digestive system cancers.
Detection Principle
Under acidic conditions, nitrite reacts with sulfanilic acid to form a diazo compound, which then couples with N-(1-naphthyl)ethylenediamine to produce a purple-red azo compound with a characteristic absorption peak at 540 nm.
Applicable Samples: Water samples, Soil samples
Note: Before formal testing, it is recommended to perform a preliminary experiment with 2-3 samples expected to show significant differences.
Reagents, consumables and Equipments not provided
Microplate reader or visible spectrophotometer (capable of measuring absorbance at 540 nm)
96-well plate or micro-volume glass cuvette, Adjustable pipettes and tips
Ice maker, Centrifuge, 2 mm sieve
Deionized water
Procedure
1. Reagent Preparation
| Reagent Name | Preparation | Notes |
| Reagent Ⅰ | Ready-to-use. Equilibrate to room temperature before use. | Store at 4°C. |
| Reagent Ⅱ | Ready-to-use. Equilibrate to room temperature before use. | Store at 4°C protected from light. |
| Reagent Ⅲ | Ready-to-use. Equilibrate to room temperature before use. | Store at 4°C protected from light. |
Note: Reagent Ⅲ and the Standard are somewhat toxic. It is recommended to perform the experiment in a fume hood.
2. Standard Curve Setup
Dilute the 1 mmol/mL Standard to 10 µmol/mL using Reagent Ⅰ. Then, dilute the 10 µmol/mL standard as shown in the table below to obtain 100, 50, 25, 12.5, 6.25, 3.125, and 1.5625 nmol/mL standards.
| Tube | Standard Volume | Reagent Ⅰ Volume (µL) | Standard Concentration (nmol/mL) |
| Std.1 | 10µL of 10 μmol/mL Standard | 990 | 100 |
| Std.2 | 100µL of Std.1 (100 nmol/mL) | 100 | 50 |
| Std.3 | 100µL of Std.2 (50 nmol/mL) | 100 | 25 |
| Std.4 | 100µL of Std.3 (25 nmol/mL) | 100 | 12.5 |
| Std.5 | 100µL of Std.4 (12.5 nmol/mL) | 100 | 6.25 |
| Std.6 | 100µL of Std.5 (6.25 nmol/mL) | 100 | 3.125 |
| Std.7 | 100µL of Std.6 (3.125 nmol/mL) | 100 | 1.5625 |
Note: A standard curve must be prepared for each experiment. Diluted standard solutions are unstable and must be used within 4 hours.
3. Sample Preparation
3.1 Soil Sample: Take an appropriate amount of soil sample, remove impurities such as stones and twigs, and sieve through a 2 mm mesh. Precisely weigh 0.5 g, add 1 mL of Reagent Ⅰ, shake at room temperature for 1 hour, centrifuge at 8,000 g, 25°C for 15 minutes. Collect the supernatant for testing.
3.2 Water Sample: Test directly. If turbid, centrifuge first before measurement.
4. Experimental Steps
4.1 Preheat the microplate reader or visible spectrophotometer for 30 minutes and set the wavelength to 540 nm. Zero the visible spectrophotometer with deionized water.
4.2 Operation Table (perform in a 96-well plate or micro-volume glass cuvette):
| Reagent (µL) | Blank Well | Standard Well | Test Well |
| Reagent Ⅰ | 70 | 0 | 0 |
| Standard | 0 | 70 | 0 |
| Sample | 0 | 0 | 70 |
| Reagent Ⅱ | 65 | 65 | 65 |
| Reagent Ⅲ | 65 | 65 | 65 |
4.3 Mix rapidly, incubate at 25°C for 15 minutes. Measure the absorbance at 540 nm, recorded as ABlank, AStandard, ATest. Calculate ΔATest = ATest - ABlank and ΔAStandard = AStandard - ABlank.
*Note: The blank and standard wells only need to be measured once. It is recommended to perform a preliminary experiment with 2-3 samples showing expected large differences before formal testing. If ΔA<sub>Test</sub> is less than 0.001, appropriately increase the sample amount. If ΔA<sub>Test</sub> is greater than 2.0, further dilute the sample with Reagent Ⅰ and multiply the result by the dilution factor, or reduce the amount of sample used for extraction.*
5. Calculation of Results
Note: We provide two formula sets: the derived calculation formulas and the simplified formulas. They are completely equivalent. The simplified formulas are recommended as the final calculation formulas.
5.1 Plotting the Standard Curve
Plot the standard curve with the standard concentration as the y-axis and ΔA<sub>Standard</sub> as the x-axis. Substitute ΔA<sub>Test</sub> into the standard curve equation to obtain y (nmol/mL).
5.2 Calculation of Nitrite Content in Samples
(1) Soil Sample
NO₂⁻ (nmol/g) = y × VSample × VTotal ÷ VSample ÷ W × n = 2y × n
(2) Water Sample
NO₂⁻ (nmol/mL) = y × n = y × n
Parameter Description:
VSample: Sample volume, 0.07 mL;
W: Sample mass, 0.5 g;
VTotal: Volume of Reagent Ⅰ added, 1 mL;
n: Dilution factor of the sample.
6. Example Results
6.1 Typical Standard Curve
y = 89.365x - 0.918, R² = 0.999
Figure 1: NO₂⁻ Standard Curve
6.2 Experimental Example
Figure 2: NO₂⁻ content in soil determined by the kit
Notes
This product is for scientific research use only and is not intended for clinical diagnosis. For your safety and health, please wear a lab coat and disposable gloves during operation.
规格
别名
水土中亚硝酸盐含量检测试剂盒 微量法
英文别名
Micro Water and Soil Nitrite Content Assay Kit | Water / Soil Sample Nitrite Content Assay Kit
英文名称
Water and Soil Nitrite Content Assay Kit (NED, Micro Method)
应用
细胞代谢
样品类型
土壤, 水样
检测方法
比色法
定量&半定量
定量
检测仪器
酶标仪,紫外-可见光分光光度计
检测波长
540
敏感性
Light-sensitive
储存与运输
储存条件
2-8°C储存,避光
运输条件
低温运输
稳定性与储存
Store at 2-8℃ long term (12 months). Store in the dark.
组分与储存
| N1508208 | Component | 96T | Storage |
| N1508208A | Reagent Ⅰ | 70 mL×2 | 2-8℃ |
| N1508208B | Reagent Ⅱ | 10 mL | 2-8℃. Store in the dark. |
| N1508208C | Reagent Ⅲ | 10 mL | 2-8℃. Store in the dark. |
| N1508208D | Standard | 500 μL | 2-8℃ |
技术文档
高级数据
质检证书(CoA,COO,BSE/TSE 和分析图谱)
C of A & Other Certificates(BSE/TSE, COO):
输入批号以搜索分析图谱:
通过匹配包装上的批号来查找并下载产品的 COA,每批产品都进行了严格的验证,您可放心使用!
| 批号(Lot Number) | 证书类型 | 货号 |
|---|---|---|
 ZJ26F0332377 ZJ26F0332377 |
分析证书 | N1508208 |
技术文档和文章
溶液计算器
产品仅提供给经过验证的企业、机构和合格的专业人员用于研发。不适用于人类、动物、诊断或治疗。
Copyright © 2023至今 上海阿拉丁生化科技股份有限公司 保留所有权利。


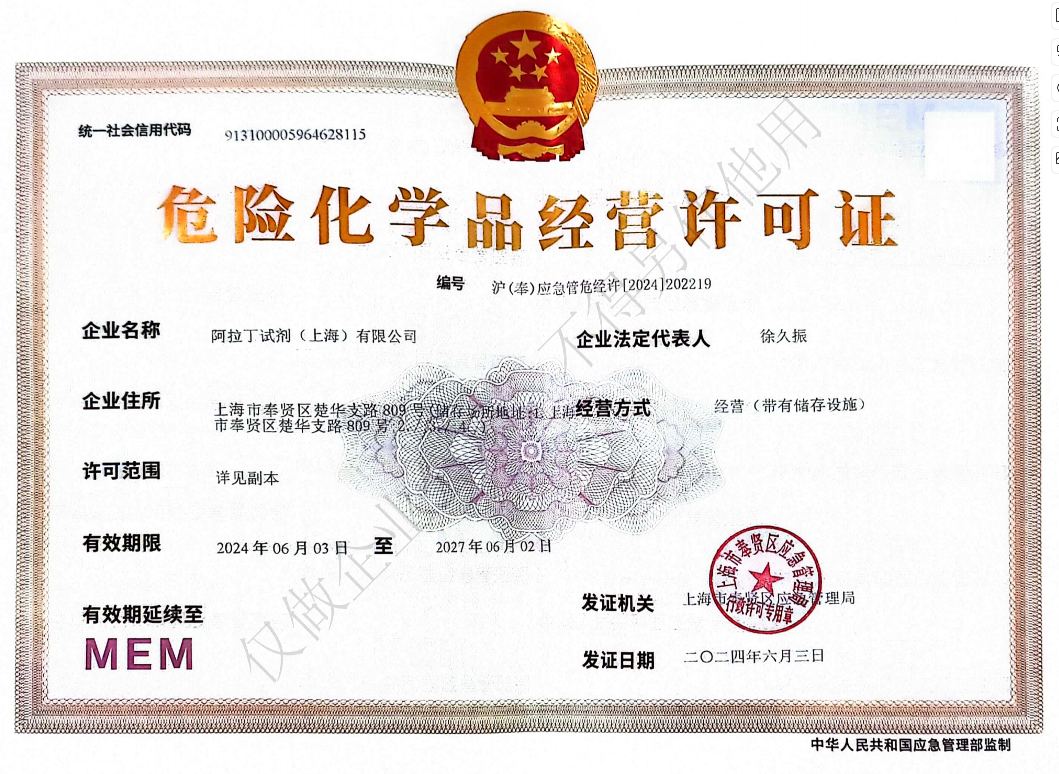 危险品化学品经营许可证(带存储)